The WIN Assessment Scoring System is a thorough scoring method that connects scientific principles with familiar baseball/softball scouting terms. It assesses a player’s hitting abilities by examining several key factors: impulse control, decision-making, visual discrimination, pattern recognition, motor planning, motor coordination, and neuromuscular ability. These factors are then correlated with a range of batting performance metrics, including swing decision, reaction time, on time rate by pitch types and location, early vs. late swings, hard hit rate, chase rate, plate discipline, and power metrics such as bat speed.
Scores
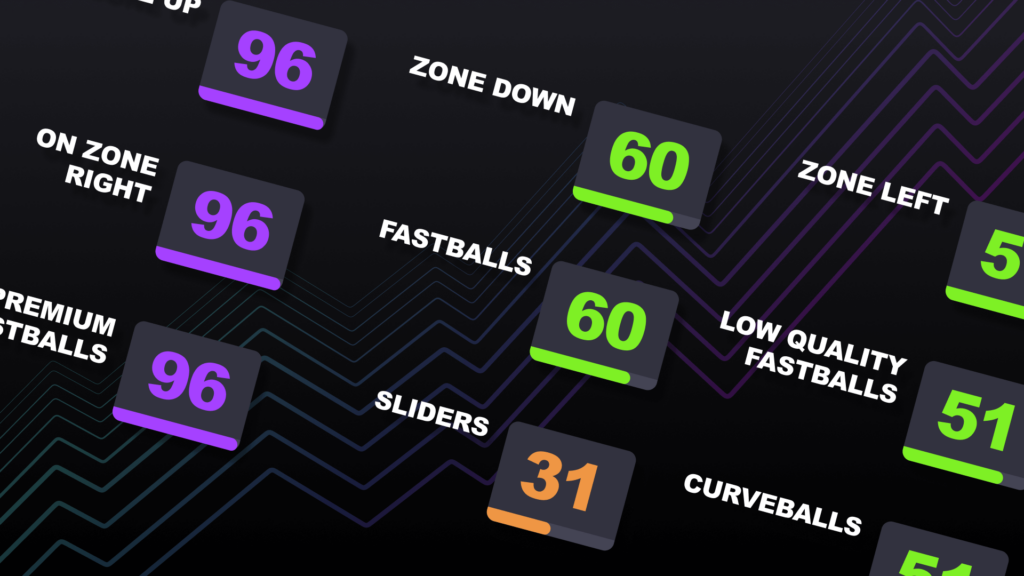
Scores are based on the percentile all hitter falls into for each skill area for your age group. If you score 100, you’re among the best at this skill, while a score of 0 indicates you’re at the lowest. Scores are grouped by Skill Categories (Vision, Timing and Power). Within each category are Primary Scores (ie: Swing Decision or Reaction Time) that are comprised of one or more Sub Scores. Sub scores break down your primary score into greater detail by pitch location and pitch type. Even if your primary score is really good, you may have a weakness within a subscore that you can still improve on.
Vision
Your ability to attack pitches in the strike zone, and lay off pitches out of the strike zone. To have success at the plate, having a great eye is crucial.
- Swing Decision: Your overall ability to attack pitches in the strike zone and take pitches out of the zone
- Out of Zone Take Rate: Your ability to lay off balls
- In Zone Swing Rate: Your ability to attack strikes
Timing
Your ability to adjust to pitches at different speeds and locations. We will break down your timing score to evaluate how well you adjust from high speeds to slower speeds, and slow speeds to higher speeds. Your score will also provide how well you are able to adjust to changes in eye level as the pitch sequence moves across the strike zone.
- Reaction Time: Your overall ability to stay on time with a sequence of pitches that are changing location and/or speeds
- Adjust Offspeed: Your ability to adjust and be on time with a pitch that is slower than the previous pitch (Fastball to Changeup, Fastball to Curveball)
- Adjust Velocity: Your ability to adjust and be on time with a pitch that is faster than the previous pitch (Changeup to Fastball, Curveball to Fastball)
- Drift: Your ability to adjust to pitches that are sequenced to different parts of the strike zone. Example: Drift Up will measure your ability to be on time with a pitch that is higher in the strike zone than the previous pitch.
- On Time Rate: Your ability to execute a swing on time with each pitch
- Zone: Your ability to be on time with pitches in certain areas of the strike zone
- Premium Fastballs: Your ability to be on time with fastballs that are in the upper tier of velocity for your age group
- Low Quality Fastballs: Your ability to be on time with fastballs that are in the bottom tier of velocity for your age group
Power
Your ability to consistently make contact with an exit velocity greater than 80% of your age group’s max exit velocity. We will break this down further by grading your power to all locations of the strike zone along with various pitch types and speeds.
- Hard Hit Rate: How often you make contact with an exit velocity 80% or higher of your age group’s max
- Zone: Your ability to drive pitches in certain areas of the strike zone
- Premium Fastballs: Your ability to drive fastballs that are in the upper tier for your age group
- Low Quality Fastballs: Your ability to drive fastballs that are in the bottom tier for your age group
- Bat Speed: How your barrel velocity stacks up against those in your age group
- Max Effort Swing Rate: Your ability to consistently swing 90% or greater than your personal max bat speed. This measures your ability to deliver a consistently powerful swing on various pitch types and locations, along with your stamina.