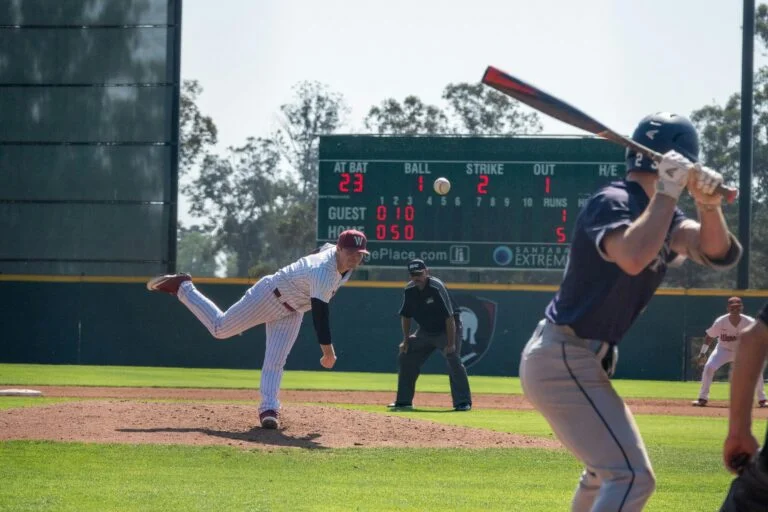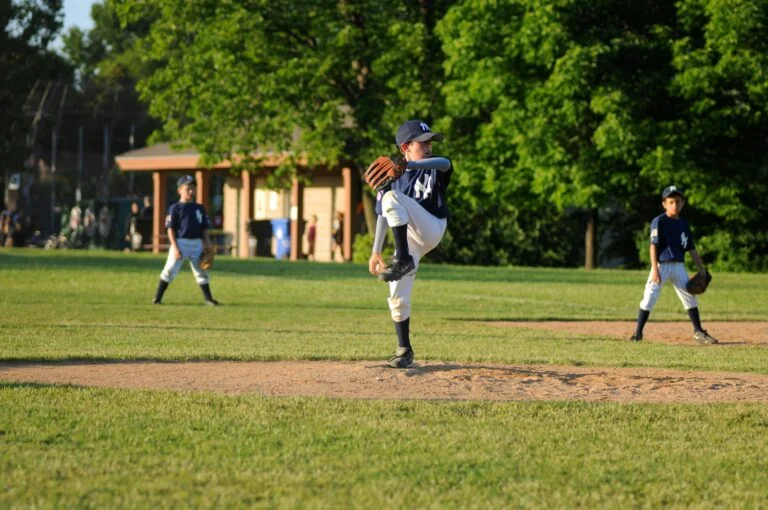
Your college program just installed a new tracking system at the ballpark. The LED board shows spin rate, release point, and movement data for every pitch, but there’s no radar gun on the backstop and no bat sensor on every player’s handle. How is this possible? The answer is optical pitch tracking, and it’s changing how programs at every level capture and use game-day data.
The Short Answer
Optical pitch tracking uses high-speed cameras to capture the full flight of every pitch, measuring spin, velocity, movement, and location without radar or wearable sensors. Systems like Yakkertech (now part of WIN Reality’s SmartPark platform, following WIN’s December 2025 acquisition) use four fixed optical cameras to track the ball from release to catch, delivering 125+ live game and ball metrics on their own, with even more available when integrated with bat sensor and biomechanic data from the rest of the WIN ecosystem.
Why This Matters Right Now
MLB clubs have used optical tracking for years to capture pitch and batted-ball data at the highest level. That same technology is now accessible to travel ball, high school, and college programs through systems like SmartPark.
What is optical pitch tracking in baseball at the youth and amateur level? It’s the bridge between guesswork and proof. Programs can now verify a pitcher’s spin efficiency, track a hitter’s exit velocity, and review automatic strike zone calls, all from the same camera infrastructure that powers the big leagues.
The takeaway: optical tracking gives your program access to verified, MLB-grade data without adding hardware to every player.
The Problem Everyone Experiences
Walk into most parks and you’ll see a familiar scene. Scorekeepers toggle between paper books and spreadsheets. Coaches estimate pitch counts and velocities from memory. Parents squint at radar guns with inconsistent readings. And players leave the field with no actionable data to review.
The gap is real. Between-game development (VR training, swing analysis, bullpen sessions) produces data, but live competition rarely does. Scouts and recruiters want verified metrics from actual games, not practice footage. Without a capture system, your field is a data blind spot.
Optical pitch tracking solves this by turning every pitch and swing into measured, shareable data, automatically, from fixed cameras that require no player-worn hardware.
How It Actually Works
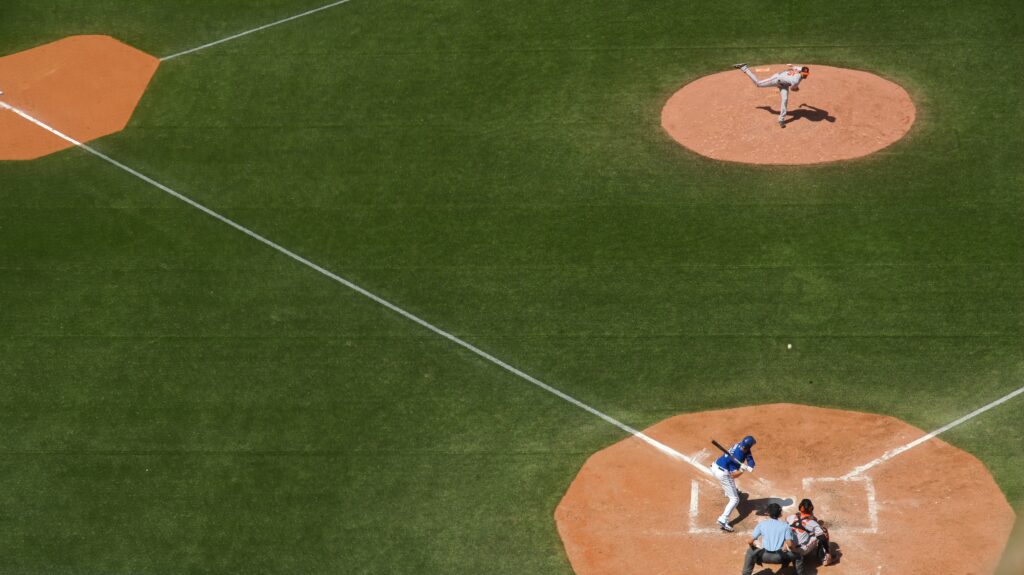
Optical tracking systems like Yakkertech use multiple fixed cameras positioned around the field. These cameras capture the ball’s full trajectory at high frame rates, then process the footage using computer vision algorithms to extract key metrics.
Here’s what the system measures in real time:
- Ball Metrics (88 total): Velocity, spin rate, spin axis, vertical and horizontal movement, release point, and pitch location
- Game Metrics (35 total): Count, outs, runners, pitch sequence, and game state
Together, these two categories are the core of Yakkertech’s optical capture — the “125+ live metrics” figure you’ll see cited for SmartPark. Two more categories add on top of that core when the rest of the WIN ecosystem is connected:
- Bat Sensor Metrics (12 total): Bat speed, time to contact, attack angle, and hand speed, when integrated with Blast Motion sensors
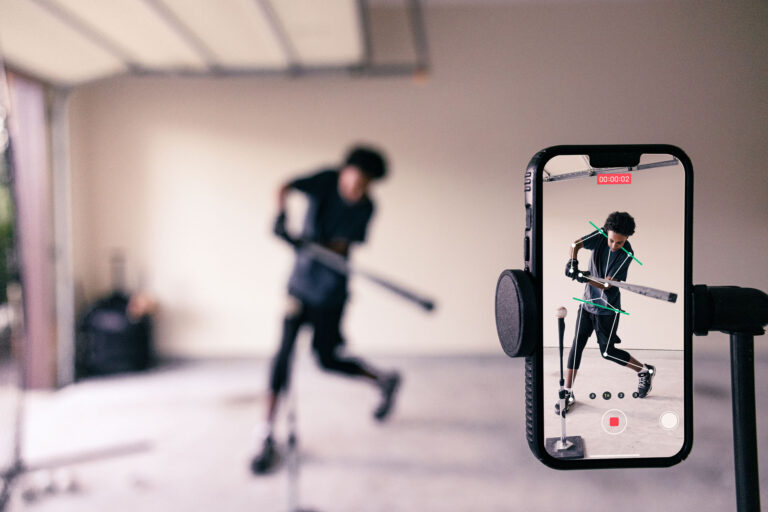
- Biomechanic Metrics (12 total): Body positioning and movement patterns, when integrated with SwingAI
The optical camera system captures the entire scene, so the core 125+ metrics come from every pitch and every at-bat without manual tagging. This is how Automatic Balls & Strikes (ABS) works: the cameras track the ball through the zone, compare it against the rulebook strike zone, and display the call instantly on the LED board and in the WIN Gameday App.
No bat sensor required for pitch tracking. No radar gun for velocity. One camera infrastructure powers the core data, with more available the deeper you connect it into WIN’s other tools.
Common Misconceptions
“Optical tracking is the same as radar.” Radar measures velocity by timing a single point. Optical cameras capture the ball’s entire flight path, which means you get spin rate, movement, and release point in addition to velocity.
“You need wearable sensors for every player.” Bat sensors like Blast Motion add swing data, but the core pitch and ball tracking runs entirely on fixed cameras. Players step into the box and data starts flowing.
“Only MLB stadiums can run this technology.” SmartPark is built for travel ball, high school, and college programs. The system uses fixed installation at your home field and connects to tools your staff already uses, from SmartParkOps.com for scorekeeping to Playbook365 for rosters and schedules.
“It’s too complicated for our staff.” SmartPark is designed for turn-on-and-play operation. Check the SmartPark System Overview quick-start guide to see how field operators start games in minutes, and the Pace of Play Clock keeps things moving without manual intervention.
What Changes in Practice
When your field runs optical tracking, every at-bat becomes a development opportunity. Here’s what shifts:
- Game-day data flows automatically. No extra setup, no manual entry, no guessing.
- Coaches review real pitch data between innings. Spin rates, locations, and sequences are all available in the app.
- Players leave with verified metrics. Exit velocity, swing decisions, and pitch recognition data travel home with them.
- Recruiters get proof. Scouts can access game-verified metrics instead of relying on showcase bullpens alone.
- Parents see real progress. Stats show up in the Fan In-Game App in real time, so families can follow along and track improvement across a season.
The difference between running it like the pros and running it like everyone else comes down to data. SmartPark closes that gap.
Beyond Pitch Tracking
Optical tracking is the foundation, but SmartPark connects to the full WIN Reality ecosystem. Here’s what that means for your program:
- SwingAI lets players upload swings and get instant AI-powered feedback on mechanics, so game-day data connects to between-game development.
- TrainVR offers game-speed VR reps against real pitch profiles, building timing and recognition before players step back into live at-bats.
- Blast Motion integration adds bat sensor metrics to the ball and game metrics already captured, giving a complete picture of every swing.
The system moves from game-day capture to training to recruitment, all in one connected performance stack.
Frequently Asked Questions
What is optical pitch tracking in baseball compared to radar? Optical pitch tracking uses cameras to capture the ball’s full trajectory, measuring spin, movement, release point, and velocity. Radar measures velocity alone by timing a single point. Optical systems deliver richer data from every pitch.
Does optical pitch tracking require sensors on players? No. The fixed camera system tracks every pitch and batted ball automatically. Bat sensors are optional and add swing metrics, but the core tracking runs without any player-worn hardware.
How accurate is optical tracking? SmartPark uses the same optical, camera-based tracking approach that powers MLB’s own ball-tracking systems, now brought to college and travel ball fields through Yakkertech.
Can my program afford this technology? SmartPark is designed for fixed installation at your home field. Contact WIN Reality through the SmartPark product page to learn about setup and pricing for your specific facility.
How does SmartPark connect to training tools? Post-game data hands off directly to WIN’s training ecosystem. Players can review metrics in SwingAI, compare to VR sessions in TrainVR, and track Blast Motion bat data, all from the same performance profile.
Start Running Your Field Like the Pros
Optical pitch tracking is no longer reserved for MLB stadiums. With SmartPark, your program gets 125+ live core metrics, Automatic Balls & Strikes, and a complete game-day data capture system, all from fixed cameras and MLB-grade tracking technology.
Turn your field into a connected, data-rich environment where every pitch and every swing count.