Picture a Saturday tournament: 40 games across eight fields, one scorekeeper per diamond. SmartPark captures 125+ live metrics on every one of those fields at once. This guide is SmartPark metrics explained in plain language: what your field tracks, how, and why 125+ live stats change your program.
SmartPark Metrics Explained
SmartPark tracks 125+ live performance metrics during real games, split across 35 game metrics, 88 ball metrics, 12 bat sensor metrics, and 12 biomechanic metrics. Fixed optical cameras and MLB-grade tracking capture every pitch, swing, and at-bat, then push the data to coaches, players, and fans in real time.
Why SmartPark Metrics Matter Right Now
Here is the shift: SmartPark captures all 125+ metrics during live games, not just controlled cage reps. Traditional tools track swings in practice, where the pitch count is 0 and the pressure is off.
A cage swing and a game swing rarely match. SmartPark measures the swing that shows up with two strikes and a runner on second, across every one of your fields.
Connected fields turn each diamond into a live data source. That is why live capture, not training-only capture, is becoming the new baseline. See how it works on the SmartPark product page.
The Problem Every Program Experiences
A single game can generate hundreds of data points, and 125+ metric types compound fast without a system to organize them. Three problems show up again and again:
- Cage numbers look great, but that production doesn’t show up in the box score.
- Radar guns disagree, with readings that can swing by several mph gun to gun.
- Data piles up with no time to make sense of it during a 7-inning game.
SmartPark fixes the organization problem by grouping all 125+ metrics into four clear categories. Next, here is how the data gets captured.
How SmartPark Metrics Capture Actually Works
SmartPark uses fixed optical cameras and MLB-grade tracking to record all 125+ metrics on every pitch, swing, and at-bat. The same style of optical tracking powers pro ballparks, so your field can run it like the pros.
Here is the hardware and software stack:
- Optical Camera System: fixed cameras that capture the 125+ metrics automatically.
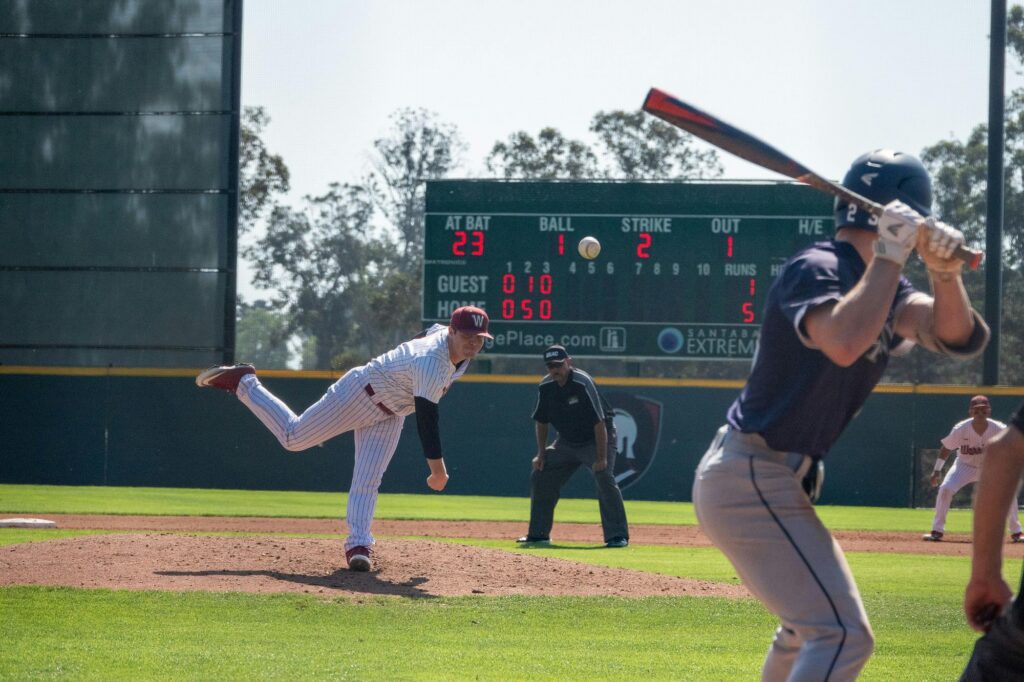
- LED Display: shows live counts, scores, and stats to everyone at the ballpark.
- WIN Gameday App: puts real-time game-day data in your hand.
- SmartPark Ops: the field-operator and scorekeeping hub.
Optical tracking reads the ball and body without wearables or radar guns. For a primer on optical ball tracking, read our blog. New to the system? Start with the SmartPark System Overview quick-start guide. Set up once, then capture pro-grade data every inning.
The 125+ SmartPark Metrics Explained by Category
SmartPark organizes all 125+ live metrics into exactly four groups. That structure is what keeps 125+ data points usable during a live game.
Game Metrics (35) and Ball Metrics (88)
These two groups make up 123 of the 125+ metrics. Game metrics (35) track the flow of play. Ball metrics (88) track what the ball does off the bat and out of the hand.
- Game metrics: counts, scoring, pace, and situational context, roughly 35 in all.
- Ball metrics: examples like exit velocity, pitch speed, and spin, the largest group at 88.
According to MLB’s Statcast glossary, exit velocity measures how hard a ball is hit right off the bat. SmartPark captures those 88 ball metrics live on your field, not in a cage.
Bat Sensor Metrics (12)
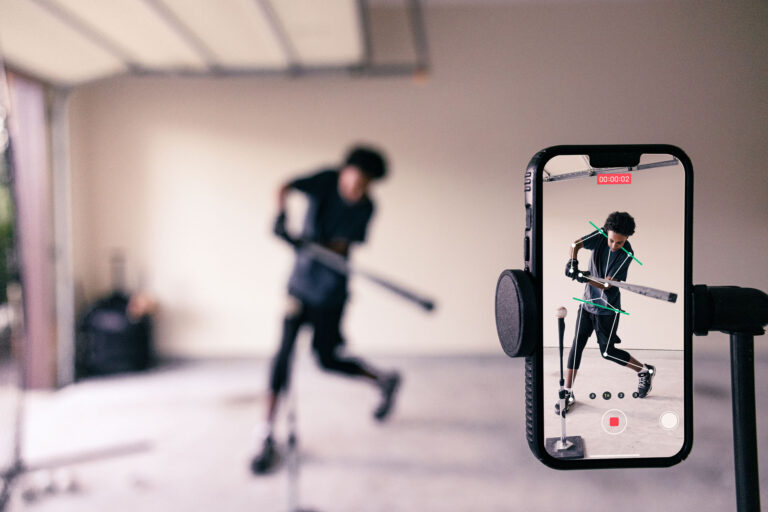
Bat sensor metrics number 12 and describe the swing itself, not the result.
- Examples: swing speed, bat path, and time to contact, 12 metrics in all.
- Best use: pair the 12 bat metrics with video to sharpen mechanics.
These 12 numbers connect straight into WIN training tools, so a game swing becomes a training target.
Biomechanic Metrics (12)
Biomechanic metrics also number 12 and measure how the body moves through the swing. Think rotation, sequencing, and load.
- Examples: swing rotation and body sequencing, 12 metrics in all.
- Why it matters: mechanics drive the 88 ball metrics you see downstream.
Together, all four groups add up to 125+ live metrics in one place. One taxonomy, every swing, every pitch.
Common Misconceptions About SmartPark Metrics
Three myths come up in every dugout. Here are the facts, with numbers:
- “Automated balls and strikes kills the human element.” Automatic Balls & Strikes calls 1 consistent zone every pitch, freeing umpires to manage the game.
- “Faster is always better.” Not with time to contact, where a lower number by even 0.01 seconds can beat raw bat speed.
- “Cage and BP numbers hold up in games.” Often 0 of that cage production survives live pitching, which is why live capture matters.
The 125+ metrics settle these debates with proof, not opinion.
What Changes in Practice With SmartPark
Four core features change how game day runs with SmartPark on the field:
- Automatic Balls & Strikes: 1 consistent strike zone, every pitch, every inning.
- Pace of Play Clock: keeps 7-inning games moving and cuts dead time.
- Game Scoring: live scoring that updates all 125+ metrics as they happen.
- Fan In-Game App: puts real-time stats in every fan’s hand at the ballpark.
Scorekeepers, umpires, and field operators run all of this from SmartPark Ops. One operator can manage a full game with the clock, scoring, and calls in one place. Fewer manual tasks means more time to coach.
Benefits by Audience
Every role gets something different from the same 125+ metrics:
- Coaches: real-time insight into all 125+ metrics to adjust lineups and mechanics mid-game.
- Players: verified proof of swing speed and exit velocity to show the skills scouts want.
- Parents: postgame reports that turn 1 game into clear, shareable progress.
- Event and program operators: automated scoring and officiating that let 1 operator run a field.
Program directors gain the most leverage: one institutional setup can serve a full roster, not 1 player at a time. One system, four wins.
Beyond Metrics: The Connected System
SmartPark is more than 125+ numbers. It is a connected system that plugs into the tools your program already uses:
- Playbook365: syncs rosters and schedules automatically.
- Live streaming: broadcasts games through an open API.
- WIN Training handoff: sends game swings to SwingAI, Blast Motion, and TrainVR.
After the final out, your players’ 12 bat metrics and 12 biomechanic metrics flow into training. A game swing becomes a SwingAI target and a TrainVR rep the same week. That loop, live game to at-home reps, is what makes the SmartPark ecosystem different. Capture on the field, improve off it.
Frequently Asked Questions
Does Automated Balls And Strikes Remove The Umpire?
No. Automatic Balls & Strikes calls 1 consistent zone, while umpires still manage safety, plays, and game flow.
Do Cage Numbers Hold Up In Real Games?
Often not. SmartPark captures all 125+ metrics live, so you see the swing that performs with the game on the line.
How Accurate Is SmartPark Tracking?
SmartPark uses MLB-grade optical tracking, the same category of technology described in MLB’s Statcast glossary.
How Many Metrics Does SmartPark Track?
SmartPark tracks 125+ live metrics in four groups: 35 game, 88 ball, 12 bat sensor, and 12 biomechanic.
Who Runs SmartPark On Game Day?
Scorekeepers, umpires, and field operators run it from SmartPark Ops, and 1 operator can manage a full game.
Join The SmartPark Era
Your field can capture all 125+ live metrics starting this season. Turn any diamond into a connected, pro-grade venue.